


GRID
Description
The GRID object can be used to add labeled graticule lines to your map. Initially developed in 2003 by John Novak, the GRID object is designed to be used inside a LAYER object to allow multiple GRID objects for a single map (allowing for example: a lat/long GRID, a State Plane GRID, and a UTM GRID to be displayed on the same map image).
Mapfile Parameters:
- LABELFORMAT [DD|DDMM|DDMMSS|C format string]
Format of the label. “DD” for degrees, “DDMM” for degrees minutes, and “DDMMSS” for degrees, minutes, seconds. A C-style formatting string is also allowed, such as “%g°” to show decimal degrees with a degree symbol. The default is decimal display of whatever SRS you’re rendering the GRID with.
- MINARCS [double]
The minimum number of arcs to draw. Increase this parameter to get more lines. Optional. Must be greater than 0.
- MAXARCS [double]
The maximum number of arcs to draw. Decrease this parameter to get fewer lines. Optional. Must be greater than 0.
- MININTERVAL [double]
The minimum number of intervals to try to use. The distance between the grid lines, in the units of the grid’s coordinate system. Optional. Must be greater than 0.
- MAXINTERVAL [double]
The maximum number of intervals to try to use. The distance between the grid lines, in the units of the grid’s coordinate system. Optional. Must be greater than 0.
- MINSUBDIVIDE [double]
The minimum number of segments to use when rendering an arc. If the lines should be very curved, use this to smooth the lines by adding more segments. Optional. Must be greater than 0.
- MAXSUBDIVIDE [double]
The maximum number of segments to use when rendering an arc. If the graticule should be very straight, use this to minimize the number of points for faster rendering. Optional, default 256. Must be greater than 0.
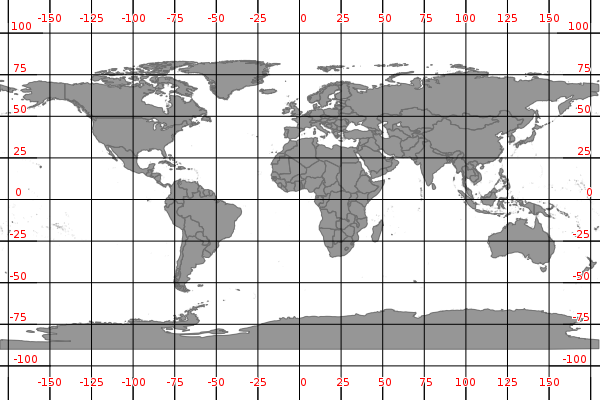
Example1: Grid Displaying Degrees
LAYER
  NAME "grid"
  METADATA
    "DESCRIPTION" "Grid"
  END
  TYPE LINE
  STATUS ON
  CLASS
    NAME "Graticule"
    COLOR 0 0 0
    LABEL
      COLOR  255 0 0
      FONT "sans"
      TYPE truetype
      SIZE 8
      POSITION AUTO
      PARTIALS FALSE
      BUFFER 2
      OUTLINECOLOR 255 255 255
    END
  END
  PROJECTION
    "init=epsg:4326"
  END
  GRID
    LABELFORMAT "DD"
  END
END # Layer
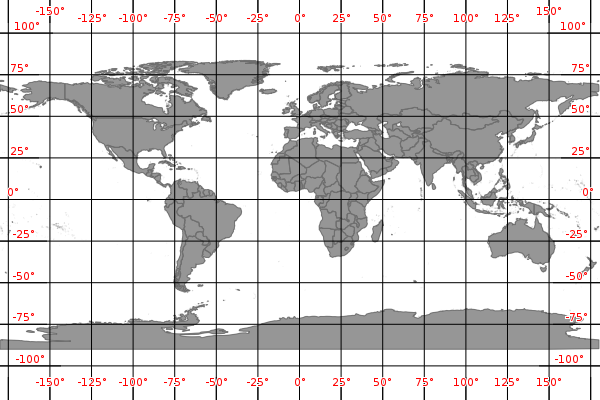
Example2: Grid Displaying Degrees with Symbol
LAYER
  NAME "grid"
  METADATA
    "DESCRIPTION" "Grid"
  END
  TYPE LINE
  STATUS ON
  CLASS
    NAME "Graticule"
    COLOR 0 0 0
    LABEL
      COLOR  255 0 0
      FONT "sans"
      TYPE truetype
      SIZE 8
      POSITION AUTO
      PARTIALS FALSE
      BUFFER 2
      OUTLINECOLOR 255 255 255
    END
  END
  PROJECTION
    "init=epsg:4326"
  END
  GRID
    LABELFORMAT '%g°'
  END
END # Layer
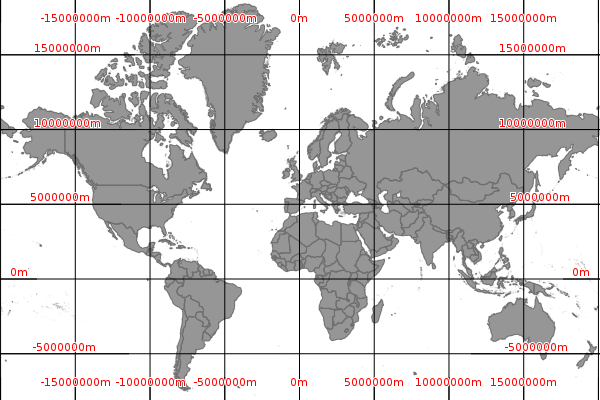
Example3: Grid Displayed in Other Projection (Google Mercator)
LAYER
  NAME "grid"
  METADATA
    "DESCRIPTION" "Grid"
  END
  TYPE LINE
  STATUS ON
  CLASS
    NAME "Graticule"
    COLOR 0 0 0
    LABEL
      COLOR  255 0 0
      FONT "sans"
      TYPE truetype
      SIZE 8
      POSITION AUTO
      PARTIALS FALSE
      BUFFER 2
      OUTLINECOLOR 255 255 255
    END
  END
  PROJECTION
    "init=epsg:3857"
  END
  GRID
    LABELFORMAT '%.0fm'
    MININTERVAL 5000000
  END
END # Layer
Note
Pay attention to the values you use for the INTERVAL parameter; it is possible to confuse/overload MapServer by telling it to draw a graticule line every meter (MININTERVAL 1).